I’ve been working with a company to come up with a ‘movement assessment score.’ Our goal is to run a client through some basic movements, and based on that come up with a score that will show how they’re doing.
This is nothing new, and a ton of companies have done something like this already. We don’t need to reinvent the wheel.
Whoop puts out a number

Here’s Garmin’s version of your body score

Heck even Wii Fit had done this
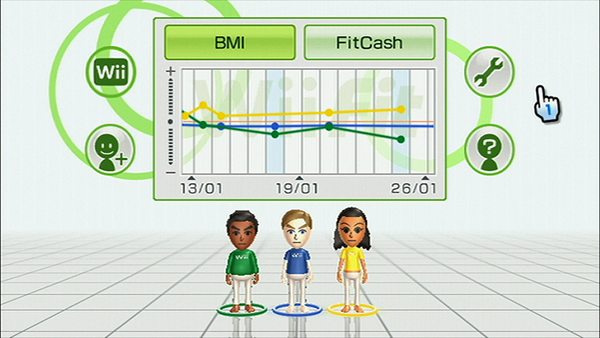
I wanted to make one as a fun little math problem for myself, and to see how I would make something like this also.
Here’s the Setup
Each client’s first session runs them through a basic bodyweight circuit.
- 30 seconds per movement
- 30 seconds rest in between
- 2 rounds total It’s on the easier beside because many of the clients are new to working out, and are more of beginners.
They do 6 movements
- Squats
- Deadlifts
- Push Ups
- Planks
- Mountain Climbers
- Downward Dog
For each movement, record the number of reps or seconds done.
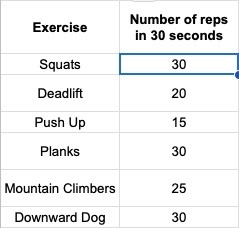
Play around with the numbers based on form and variation
If I want to get a score out of 100, I’m going to need to add some variety. I’ll do this with some multiplier modifiers.
First thing I can think of is the form. If the client does 30 push ups, but the form is garbage, they should be penalized by that.
On the other hand, if they do 20 push ups with perfect form, that should be a bonus. So I come up with this.

The numbers are arbitary at this point.
I can also add a modifier for different variations of the movements.
For example, a knee push up should be scoring less than a regular push up.
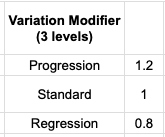
So I apply a similar transformation.
Between form quality and variations I can get 6 modifiers
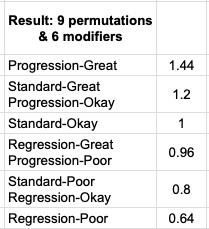
Not bad. It’s still simple, but can provide enough variation in the results.
Let’s put that in a table
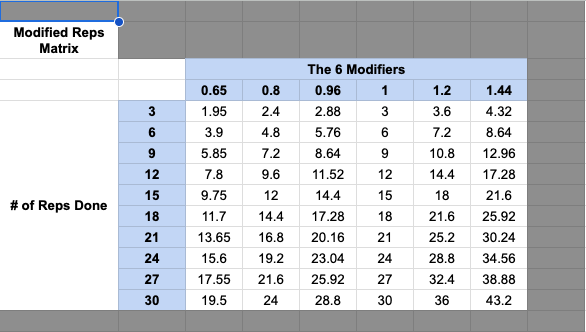
If all exercises used the same table, then 30 pushups done with Great form and a progress would be the bottom right square (which is 43.2)
This means that I’ll have to adjust this table based on what I think the ideal number of reps/seconds are for each individual exercise.
Normalizing it to a score over 100
I was thinking about how to transform this into a function out of 100.
I played around with the idea of normal distribution. Since the amount of reps a person can do should fall somewhere within the population distribution. In the end, it didn’t make sense because I don’t think I’m comparing people to their level within the population (?) I’m not sure about this and need to think some more.
So I tried a different approach.
Some things I wanted
- I want the bottom right square of the matrix to score 100 (ideal # of reps / ideal form / ideal progression)
- I want the graph to slope up fast and plateau (which is the experience of building a skill)
So it needs to look something like this.

In the end, I (arbitrarily) chose a sigmoid function of the form

which gives me the shape I want
I messed around with numbers and I ended up with

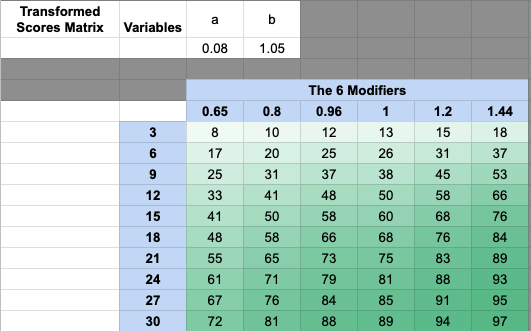
which starts at 0 and goes up to 100
I chose for a=0.08 and b=1.05. Unfortunately, those are numbers I also just came up with through trial and error.
Shifting a affects the overall number of reps So for example, if I made a=0.1 then it would take LESS reps to score higher conversely, if a=0.01 then you’d need MORE reps to score higher
Shifting b affects the bend in the curve. (i.e. how steep newbie gains are // or how early you plateau) If I made b=1.1 then lower reps would score higher (with a minimal effects on higher reps) If b=1.01 then the graph starts to look more linear
So here’s what I end up with
More Thoughts
I think I’d like the formulas to be less arbitrary, but for now I think it works.
I’d need a unique table per exercise, but it’s a good start to getting a score out of 100 for each of the 6 exercises based on the number of reps they can do.
Read more at: How to balance measureables and actual healthcare
You may also be interested in: Data has killed our intuition